2. Conditional formatting of a whole row based on single column
This GIF augments case study 2 in the ebook. It shows conditional formatting of a whole row in Google sheets.

This supplemental page is a directory of GIFs relating to some of the case studies found in the "35 Tips and Tricks in Excel and Google Sheets" ebook. If you're unable to get the videos working in the PDF copy of the ebook, please refer to the relevant GIF below to see the animation in action.
Landed here by accident and want a free copy of the ebook? No problem, sign up to get yours here.
This GIF augments case study 2 in the ebook. It shows conditional formatting of a whole row in Google sheets.

This GIF augments case study 6 in the ebook. It shows how to efficiently create column headings by first highlighting the column headings range and then traversing using the Enter key.

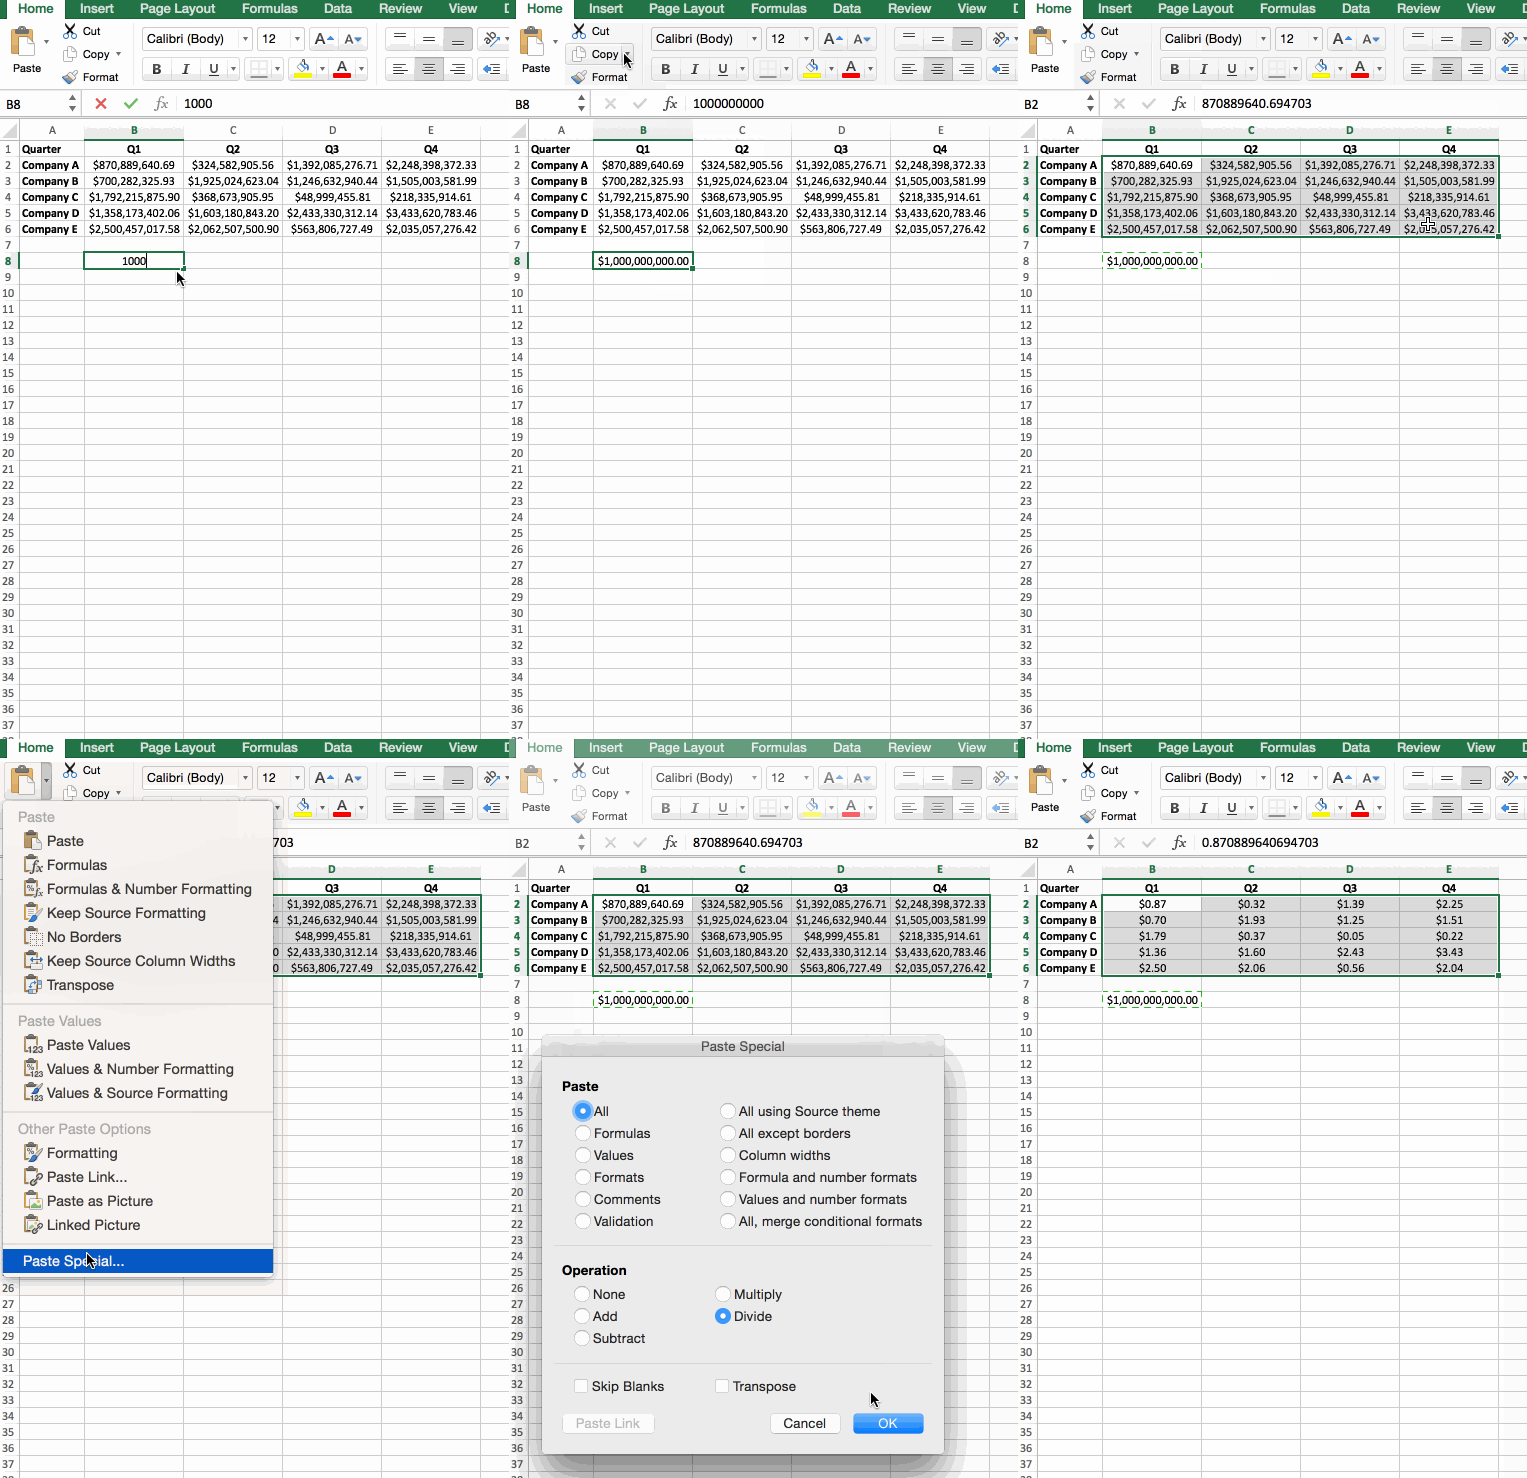
This GIF augments case study 7 in the ebook. It demonstrates using mathematical operators within the Copy-Paste Special technique to format a range of numbers.

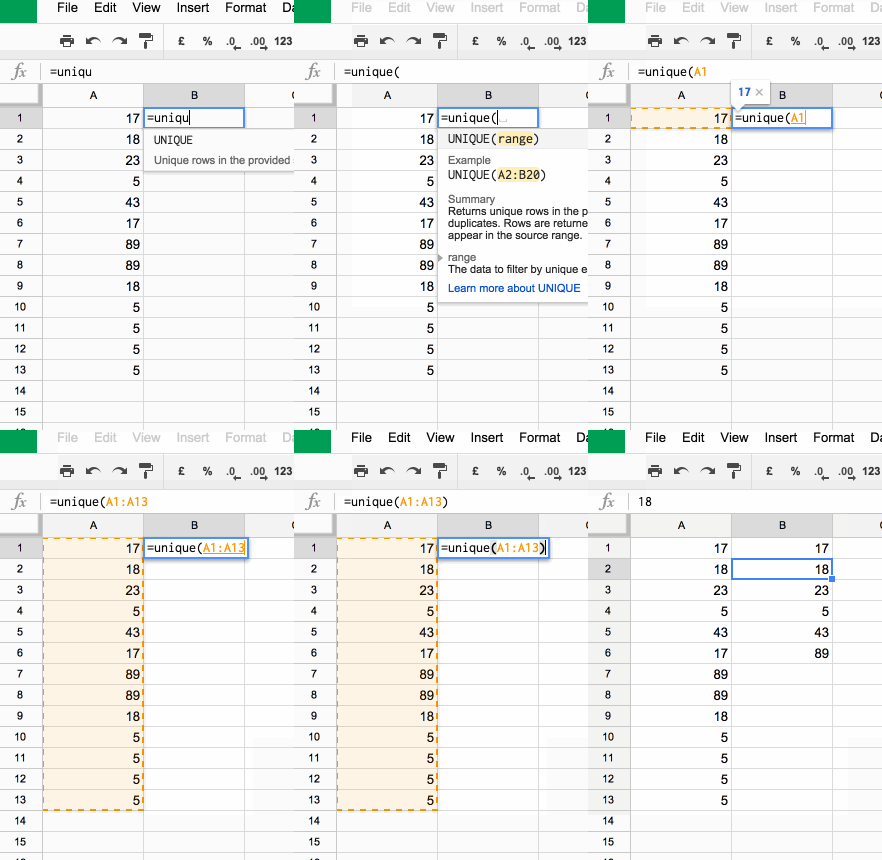
This GIF augments case study 14 in the ebook. It shows how to retrieve unique values in a column using the UNIQUE function in Google sheets.

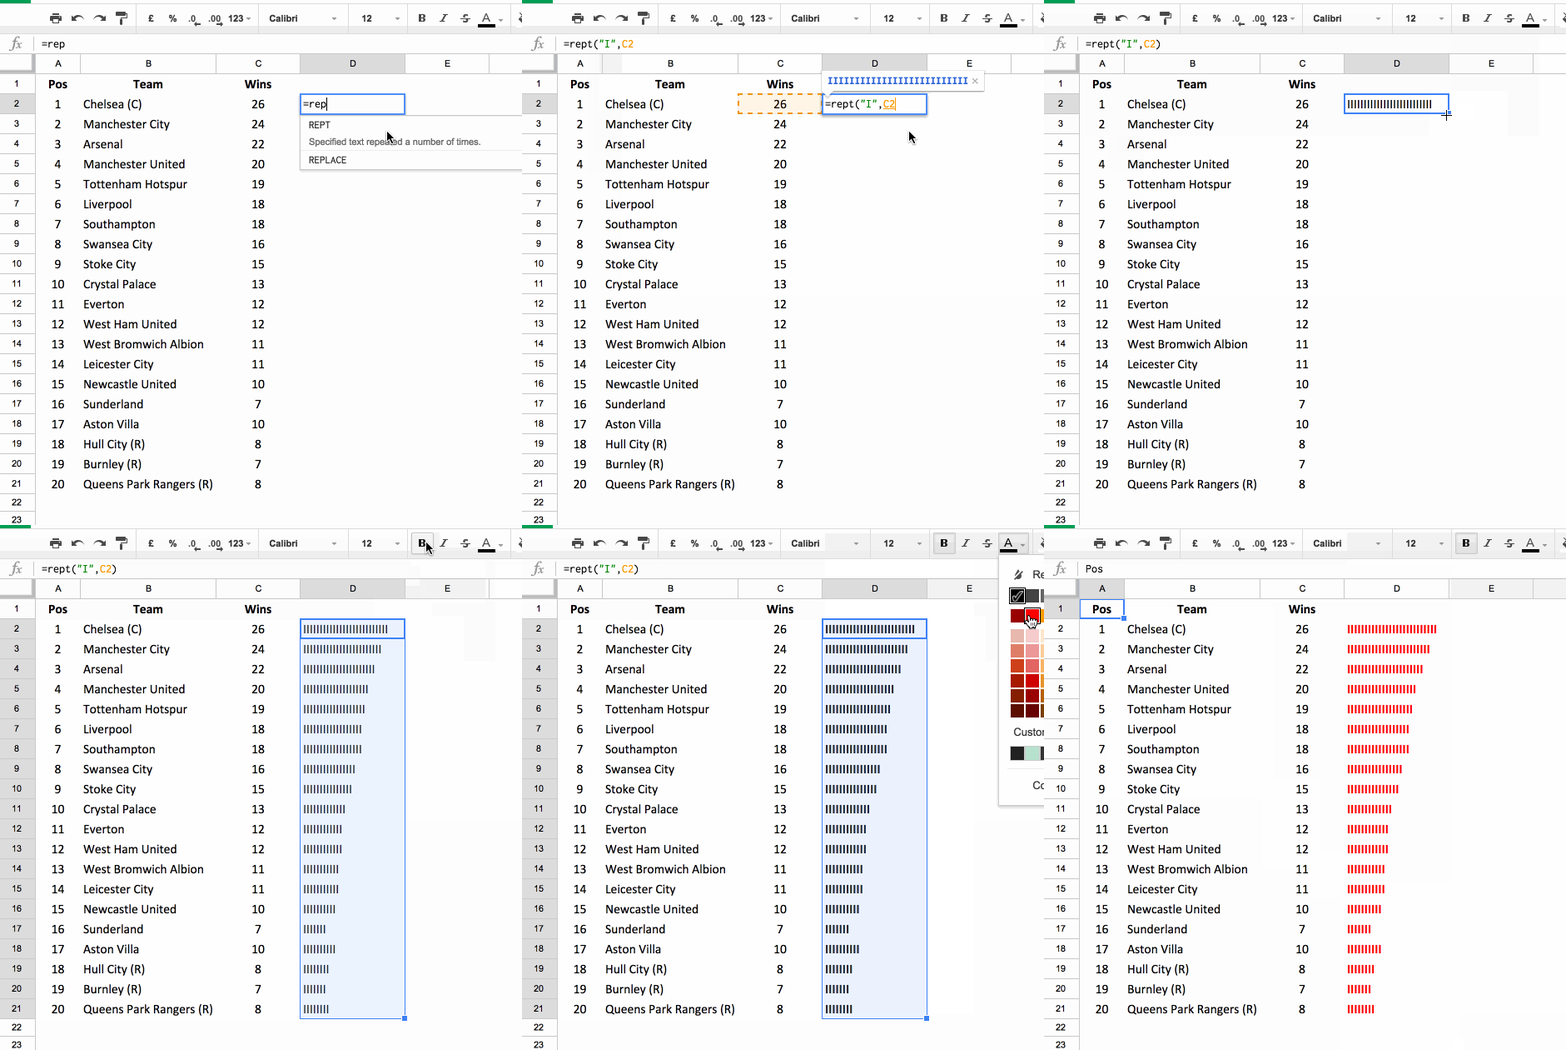
This GIF augments case study 17 in the ebook. It shows how to create cell charts using the REPT function.

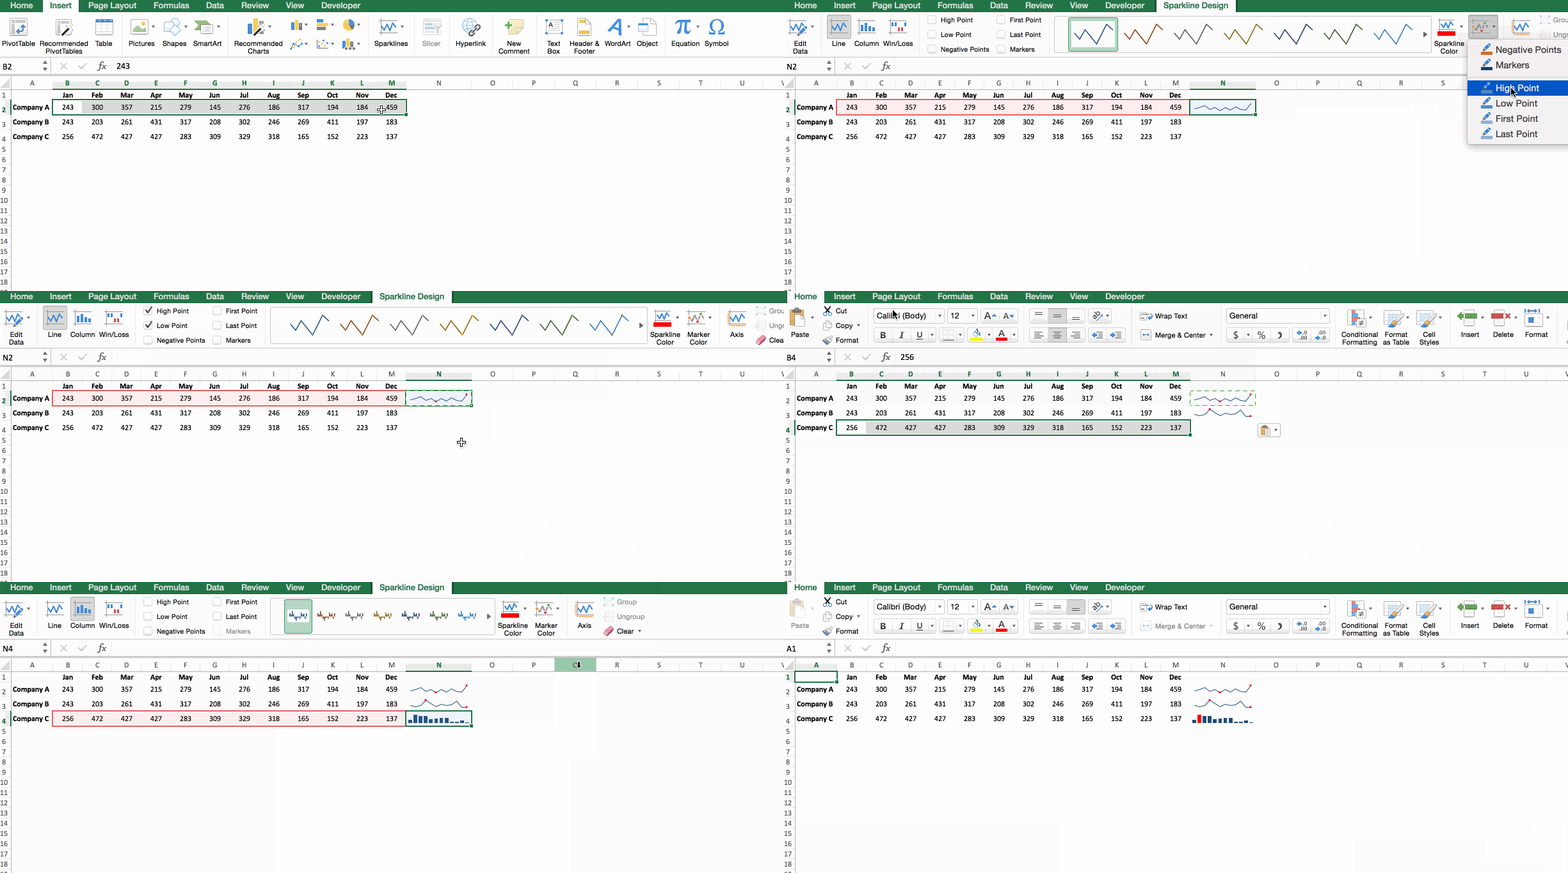
This GIF augments case study 18 in the ebook. It shows sparklines in action in Excel.

This GIF augments case study 19 in the ebook. It shows Motion charts in action in Google sheets.

This GIF augments case study 21 in the ebook. The first GIF shows how to use the FREQUENCY function in Excel to create a histogram chart.

This second GIF shows the 5-second method to create a histogram in Google sheets.

This GIF augments case study 28 in the ebook. It shows how to create a chart of Facebook's stock price over the past year, in under 30 seconds.
